stars: VT

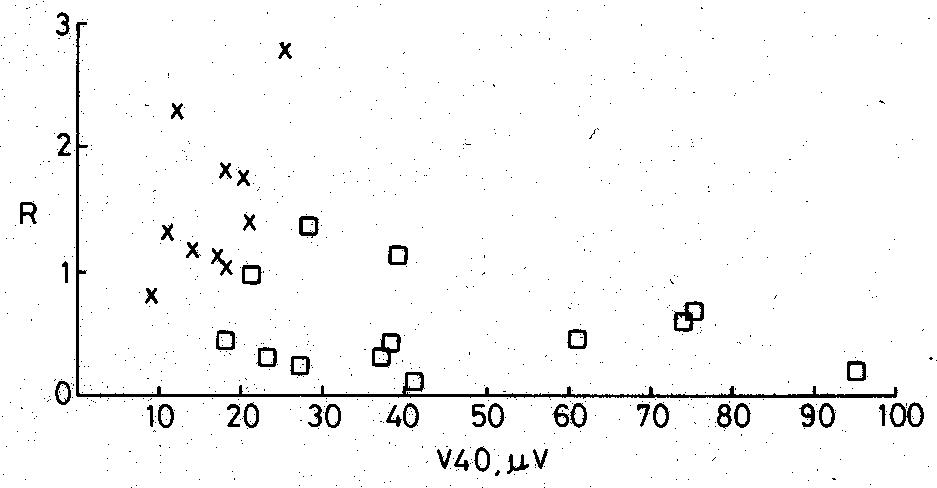
crosses: VT

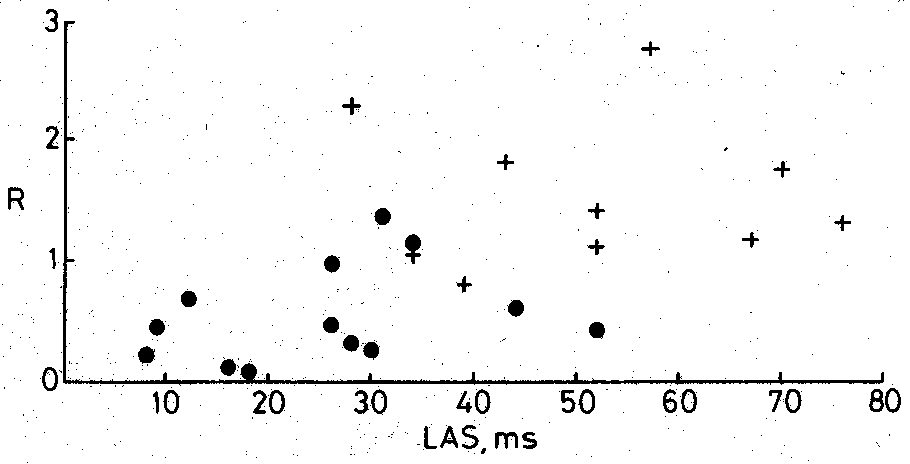
crosses: VT
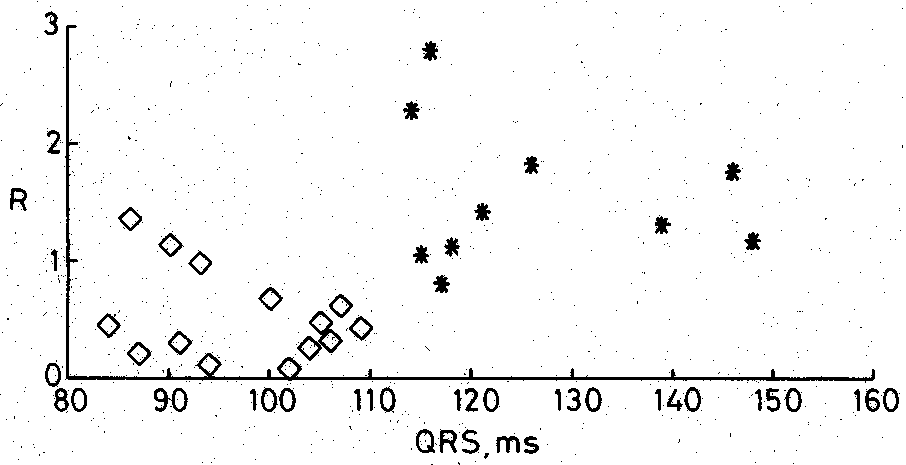
Scatter plots of the Spectral
Area Ratio (SAR) against the three time-domain parameters for the
VT (n=10) and non-VT patients (n=14):
| SAR
plotted vs. QRS duration in patients with sustained VT (stars), and non-VT
patients (diamonds)
|
diamonds: non-VT
stars: VT |
| SAR plotted
vs. V40 (rms voltage during the terminal portion of the QRS) in patients
with sustained VT (crosses), and non-VT patients (squares)
|
squares: non-VT
crosses: VT |
| SAR plotted vs. LAS
(duration of the the terminal portion of the QRS, below 40 uV) in patients
with sustained VT (crosses), and non-VT patients (circles)
|
circles: non-VT
crosses: VT |