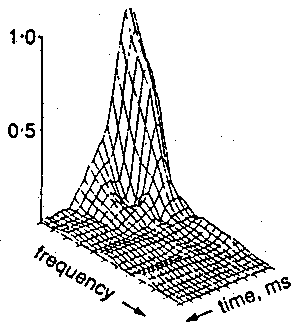
Post-MI patient with VT and late potentials
Wavelet transform (scalogram)
Prolonged high-frequency activity may be distinguished in the terminal portion of the QRS complex. This coinsides with findings in the standard high-resolution signal averaged electrocardiogram.

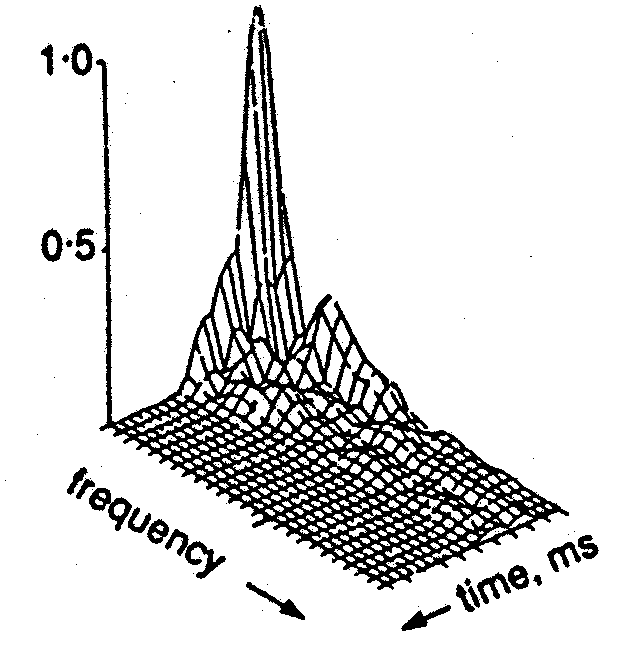
Post-MI patient with VT and late potentials
STFT (spectrogram)
Late high-frequency activity may be recognized here as well. However, frequency resolution in the range 30-80 Hz is poorer as compared to the WT. The QRS appears to set off earlier, which is due to poorer time resolution and is wrong.

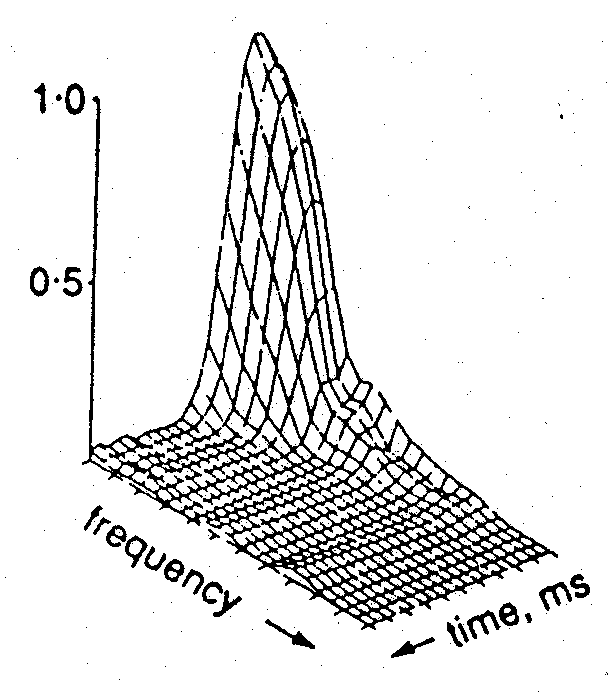
Post-MI patient with no VT and no late potentials in time domain
Wavelet transform (scalogram)
No prolonged high-frequency activity in the terminal portion of the QRS complex is observed.

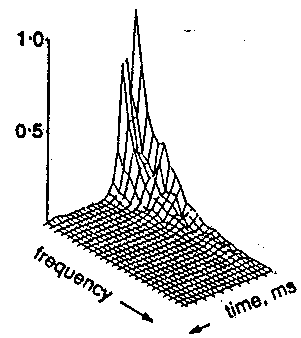
Post-MI patient with no VT and no late potentials in time domain (same as to the left)
STFT (spectrogram)
No long-lasting QRS decay may be identified here.